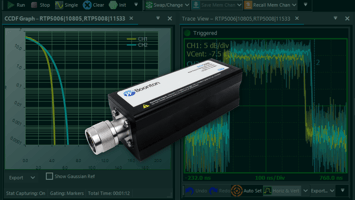
The Boonton RTP5000 Series Real-time USB Peak Power Sensors are ideal instruments for fast,...
An amplifier is used to increase a signal’s power. The input to the amplifier is the original signal, while its output is the signal reproduced at an increased amplitude, ideally without distortions.
Amplifiers are used in various RF and microwave systems, especially within communications networks. Two examples include:
High power amplifiers: A high power amplifier is typically used on the transmit side of a communications network to boost the signal’s power during the final stages before transmission.
Low noise amplifiers: One of the early steps on the receive side of a communications network is the amplification of the received signal by a low noise amplifier. This component is used to amplify weak signals while reducing the signal-to-noise ratio (SNR) as little as possible (the higher the ratio, the better).
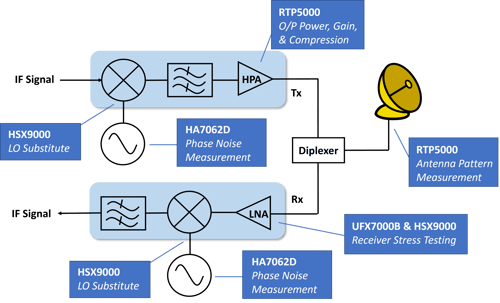
The image above shows how high power amplifiers and low noise amplifiers fit into the uplink and downlink chains of a satellite communications network, as well as critical test and measurement capabilities.
In this blog post, uncover how to test the performance of a communications amplifier, featuring the Boonton RTP5000 Series Real-time USB Peak Power Sensors and its control software – the Boonton Power Analyzer.
Compression Testing with Crest Factor and CCDF
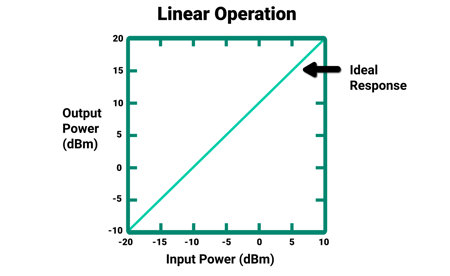
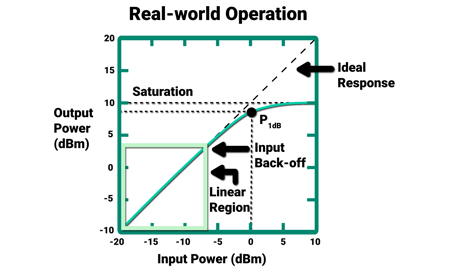
Amplifiers behave linearly when the output changes proportionally to the input. Within the linear region of operation, the amplifier has a constant gain, which is the ratio of output power to input power.
There comes a point where amplifiers start to deviate from ideal behavior. The amplifier enters compression as the gain decreases even as the input power increases. The 1 dB compression point (P1dB) is a common figure of merit during compression testing, which defines when the amplifier gain decreases by 1 dB from its linear performance.
5G and other applications that utilize higher order modulation schemes, such as orthogonal frequency-division multiplexing (OFDM), use signals with high crest factors. Also referred to as the peak-to-average power ratio (PAPR), crest factor compares a signal’s peak power to its average power. This means that modulated signals experience severe power peaks that deviate significantly from average power levels. Compressed, non-linear communications amplifiers can clip the highest peaks of a modulated waveform, leading to waveform distortion, symbol errors, and bit errors.
Peak power sensors can characterize amplifier non-linearity and compression with crest factor measurements and by plotting complementary cumulative distribution function (CCDF) curves, which provides a statistical view of crest factor occurrence. A CCDF graph shows the percentage of time or probability (y-axis) that a signal's crest factor is equal to or greater than a certain crest factor value (x-axis).
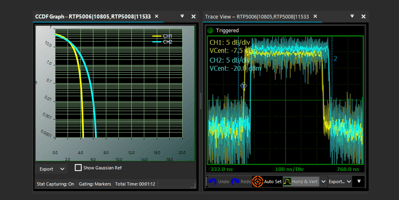
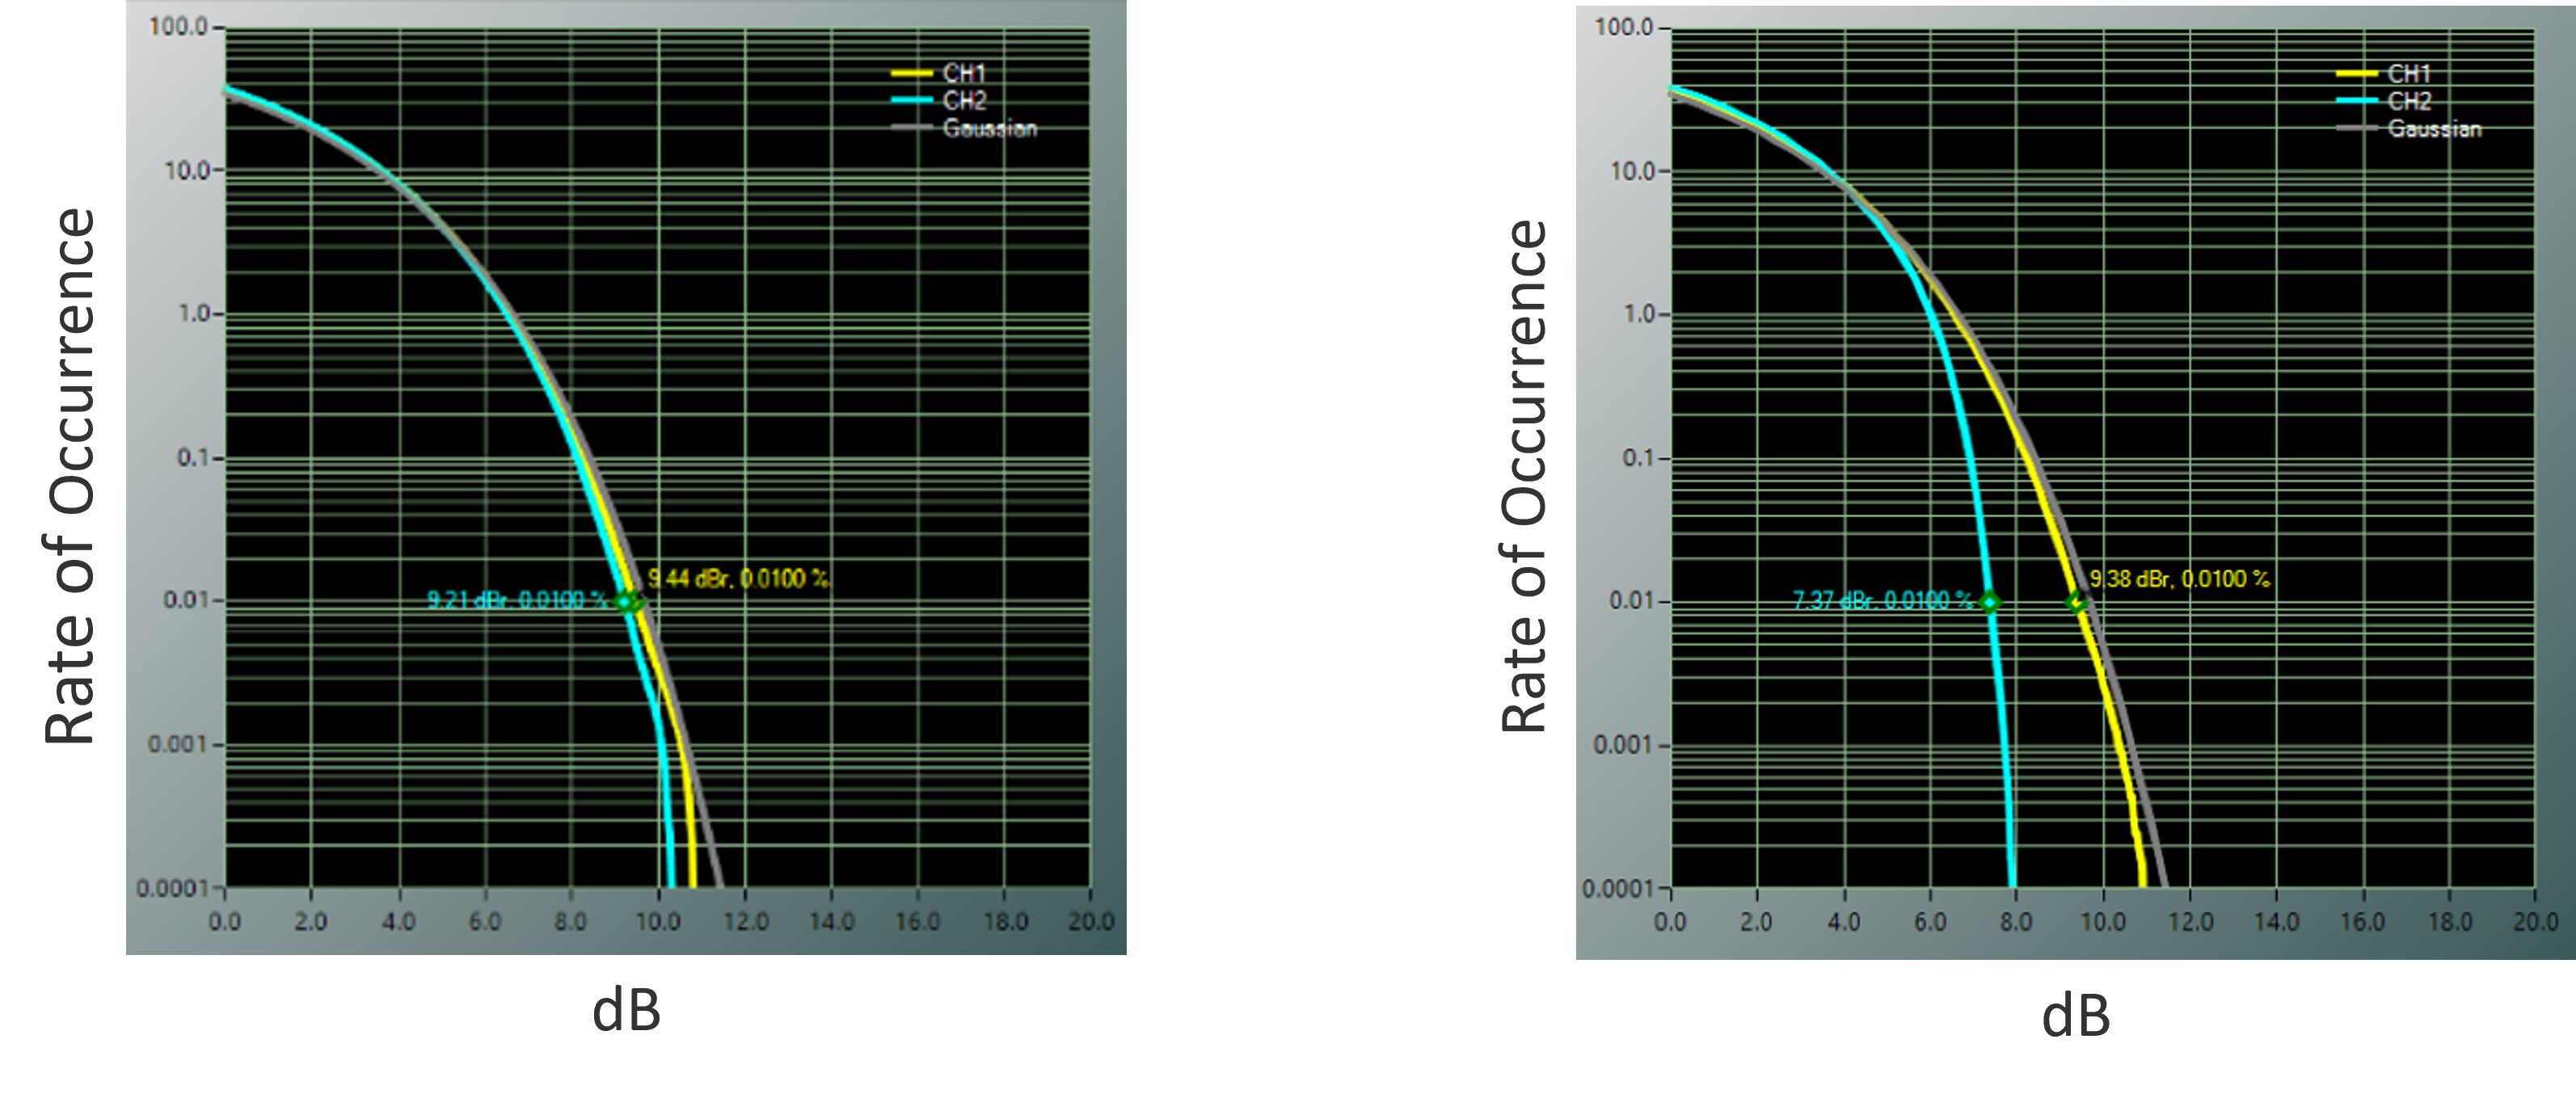
The two CCDF graphs below display the CCDF curves for an amplifier's input signal (channel 1 in yellow) and output signal (channel 2 in blue) with a 0.01% probability percentage of interest. The graph on the left shows an input crest factor of 9.4 dB, meaning the signal's crest factor is equal to or greater than 9.4 dB for 0.01% of the time (or less than 9.4 dB for 99.99% of the time). The output crest factor equals 9.2 dB. The CCDF plot verifies amplifier linearity since the input and output crest factors are virtually identical for 99.99% of the time.
At 0.01%, the graph on the right shows an input crest factor of 9.4 dB and an output crest factor of 7.4 dB. A reduction in the output signal's crest factor reveals amplifier compression.
Watch Now: Testing Amplifiers with Peak Power Sensors
The video, “How to Characterize a Communications Amplifier with Boonton Peak Power Sensors,” gives a live look at the Boonton Power Analyzer software of the RTP5000 Series during the analysis an amplifier as it increases the power of an OFDM waveform. From displaying the amplifier’s input and output on two separate measurement channels, applying measurement focus via user-defined markers, and navigating through key software capabilities, this video provides an insightful tutorial for the essentials of amplifier test.
A few notable Boonton Power Analyzer features highlighted in the video include:
“CCDF” tab: The CCDF tab reveals the CCDF plot of the input and output signals.
“Stat Meas” tab: Clicking the “Stat Meas” tab prompts a side menu to open displaying statistical measurements related to both channels. Parameters include crest factors at various percentages, the power and percentage at the cursor point, absolute average power, absolute minimum power, and absolute maximum power.
“Stat Mode Control” panel: The “Stat Mode Control” panel controls the data acquisition for the CCDF graph. Among its various features is the ability to select a cursor type and position. Selecting “Percent” as a cursor type enables users to set a desired probability in the “Cursor Pos” box. The cursor will adjust to the where the desired probability intersects with the CCDF input and output curves, revealing the power measured at that specific point. Another available cursor type is “Power,” where users can enter a desired power in dB instead of a probability.
Watch the video today and ensure the rapid identification of amplifier compression.