Error vector magnitude (EVM) is an important metric for analyzing and optimizing digital...
The complementary cumulative distribution function (CCDF) is a statistical power measurement that provides a deep understanding of signal behavior. How do you read a CCDF graph? What additional insight does CCDF offer compared to crest factor or peak-to-average power ratio (PAPR) values? Learn the answers in the blog post below, along with several important features of the Boonton Power Analyzer sensor control software for detailed statistical analysis.
Analyzing Signals using Crest Factor, PAPR, & CCDF
A single numerical value, crest factor is the ratio of a signal’s highest power level to its average power level. PAPR values are usually expressed along with the probability of the PAPR value being achieved.
Digitally modulated signals, such as those used in orthogonal frequency-division multiplexing (OFDM) systems, often have a high PAPR, meaning these signals exhibit wide fluctuations in magnitude over time.
High PAPR signals are difficult to manipulate and process efficiently. For example, amplifiers can fail to reproduce high PAPR signals accurately, leading to various challenges such as:
- Clipping of a signal’s highest peaks in power
- Non-linear amplifier operation
- Adjacent channel power leakage
- Reduction in signal quality and increasing bit error ratio
CCDF broadens the insight into a signal’s behavior since it plots the probability of encountering different PAPR levels. The y-axis represents different probabilities or percentages of time, while the x-axis shows different PAPR values. Picking a certain point on the CCDF curve will reveal the probability that a signal's PAPR is equal to or greater than the PAPR values on the x-axis.

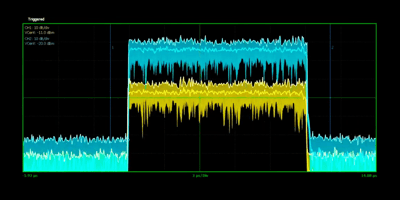
The graph above shows the CCDF curve (left) of a pulsed signal (right). The green cursor displays two important values:
- Power level: 9.5 dB
- Probability percentage of interest: 0.01%
With these figures, we can deduce that for 0.01% of the time, the signal has a PAPR that is at or above 9.5 dB. Therefore, for most of the time (99.99%), the signal’s PAPR is below 9.5 dB.
A Live Look at Measuring CCDF
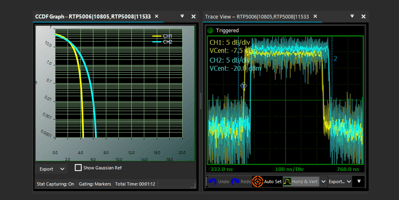
The video, “How to Measure the CCDF of a Signal with Peak Power Sensors," demonstrates how to plot a signal’s CCDF curve using the RTP5000 Series and Boonton Power Analyzer software.
The video highlights several key software features, including:
User-defined markers: The trace view of the Boonton Power Analyzer contains two vertical dotted lines. Users can drag these measurement markers to any viewable portion of the signal, enabling a detailed power analysis of specific pulse regions.
“CCDF” tab: Selecting the “CCDF” tab will display the signal's CCDF curve. Users can view both the CCDF graph and the pulsed signal side by side by choosing the “New Vertical Tab Group” option.
“Stat Mode Control” panel: This measurement window offers various ways to customize the CCDF graph’s data acquisition. Two fields of note include the “Cursor Type” and “Cursor Position.”
- Cursor Type: Users can choose between “Percent” or “Power” as a cursor type. Percent will display the relative power where the cursor intersects with the CCDF curve, while power will display the probability at the intersection point between the cursor and CCDF curve.
- Cursor Position: Defining a cursor position depends on the cursor type selection. If “Percent” was chosen as a cursor type, then users can type in a desired probability in the cursor position field. If “Power” was chosen as a cursor type, then users can input a desired power level.
“Show Gaussian Ref” check box: A “Show Gaussian Ref” check box is available on the bottom of the CCDF graph. Enabling this feature will place a Gaussian CCDF curve on the same graph that is displaying the signal’s CCDF curve, serving as a reference during analysis.
“Stat Meas” tab: The top menu’s “Stat Meas” tab reveals a side menu that displays key statistical parameters in a tabular format.
Available Now: "Measuring RF & Microwave Power" eBook
The “Measuring RF & Microwave Power” eBook from Boonton has an entire section dedicated to the importance of crest factor and statistical analysis, as well as how these measurements enable advanced testing of Wi-Fi and radar systems. Download this go-to T&M resource by filling out the form below.