An amplifier is used to increase a signal’s power. The input to the amplifier is the original...
Error vector magnitude (EVM) is an important metric for analyzing and optimizing digital communications systems. However, EVM measurements can be time consuming and require expensive equipment. In this blog post, learn how the peak-to-average power ratio (PAPR) can be used to measure amplifier linearity and predict EVM degradation easily, quickly, and cost efficiently for OFDM signals with high-order modulation systems.
Constellation Diagrams
Digital modulation involves encoding digital information (binary digits) onto a carrier signal by modifying properties such as amplitude, frequency, and phase.
Constellation diagrams represent the symbol points of modulation schemes graphically, plotting each symbol’s amplitude and phase. Each constellation point represents a specific symbol, and each symbol corresponds to a distinct bit sequence.
The points in a constellation diagram for a 16-QAM system, for example, signify individual symbols. Through amplitude and phase variations, each of the 16 symbols correspond to a unique four-bit sequence.
Error Vector Magnitude
Correct amplitude and phase information are vital for receivers during demodulation to interpret each symbol correctly. Constellation points in real-world systems, however, can deviate from ideal positions. Significant deviation can cause receivers to incorrectly decode symbols (symbol errors) and hence cause bit errors.
 EVM is used to evaluate the fidelity of a digital communications signal, measuring how far the received symbol is from its ideal location. EVM relies on vectors, which have both a magnitude and direction. In the case of EVM, the magnitude of the error vector is of interest as a measure of distortion. Maintaining EVM levels within a system’s specified level contributes to achieving the desired bit error rate.
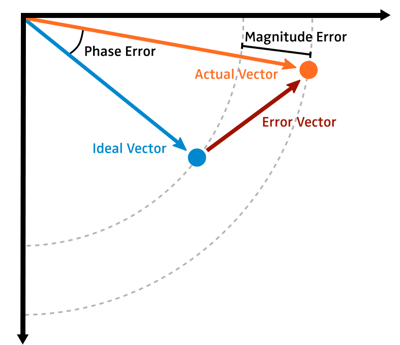
Key aspects of the constellation diagram include the following:
- Ideal vector: The ideal vector represents the expected symbol location under perfect, distortion-free conditions.
- Actual vector: The actual vector corresponds to the true position of the symbol interpreted by the receiver.
- Error vector: The error vector highlights how different the actual symbol location is from ideal positioning.
EVM & PAPR
Complex modulation schemes such as OFDM with high-order QAM inherently have high PAPR levels. If power amplifiers (PA) are driven at a level for maximum power added efficiency (PAE), the peaks can be clipped leading to increased EVM with subsequent high bit errors. Conversely, if a large input backoff (IBO) is used to assure linear operation, the PA will be operating inefficiently. The ideal point to find is the minimum IBO consistent with maintaining PAPR above a minimum acceptable level. The rate at which EVM degrades in response to a decrease in PAPR provides a linkage between the two metrics.
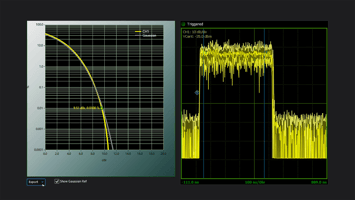
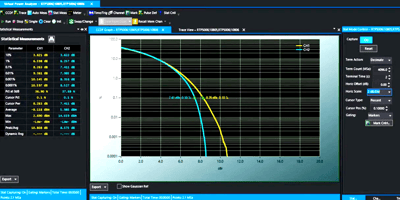
Measuring EVM to assess amplifier linearity usually requires specialized and expensive test equipment. An alternative, cost-effective approach measures PAPR (and plots CCDF curves) with peak power sensors to assess amplifier performance and its impact on EVM.
Learn more about the relationship between PAPR and EVM in the article, “A New Paradigm - Using PAPR Reduction to Assess EVM Degradation,” which is featured in the Microwave Journal eBook, “Impact of Amplifier Linearity on Communications Systems Performance – New Developments.” The article will cover how to use peak power sensors to characterize a signal’s PAPR as an indicator for EVM degradation while seeking the sweet spot between IBO and PAE, a technique that bypasses expensive signal analyzers for direct EVM measurements.