
Hosted in Washington, DC, SATELLITE 2024 is a premiere conference for the global space and...
Low-Earth orbit (LEO) satellites offer reduced propagation delay and higher signal strength due to their proximity to Earth. Low latency communications, among other factors, has spurred the popularity of LEO satellite deployments.
In this blog post, learn about LEO satellite basics and how RF and microwave power measurements are used to test the uplink and downlink chains of a satellite communications network.
Satellites in Low-Earth Orbit
LEO satellites normally operate no more than 1,200 miles above Earth’s surface, which is relatively close compared to the orbital height of satellites in medium-Earth orbit (MEO) and geostationary orbit (GEO). GEO satellites orbit at just above 22,000 miles, while MEO satellites operate in the wide range between their LEO and GEO counterparts.

Operating at low altitudes, LEO satellites travel fast around the Earth, completing an orbit about every one and a half to two hours. A single LEO satellite, therefore, can only provide coverage for a small area during a limited time interval (about 15 minutes or less) as it travels along its orbital path. To mitigate this issue, multiple LEO satellites often work together in constellations for consistent coverage.
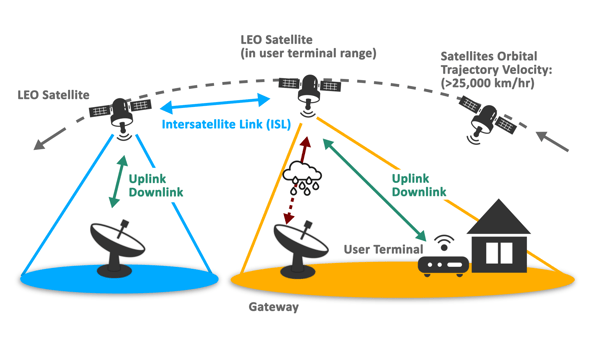
The image above shows the uplink and downlink paths of a LEO satellite network. As an individual LEO satellite falls out of contact with the gateway or ground station, another satellite is lined up to maintain communication. In addition to ground station connections, intersatellite links (ISL) enable information sharing between the satellites themselves.
Satellite Network Testing: Power, Gain, & Compression
RF peak power sensors and power meters provide critical RF and microwave power measurements for satellite uplink and downlink testing. These measurements not only analyze performance but ensure that power levels meet satellite link budget requirements. A link budget is a calculation of the end-to-end power gains and losses of a communications system and is used to ensure an end-point can reliably receive transmissions.
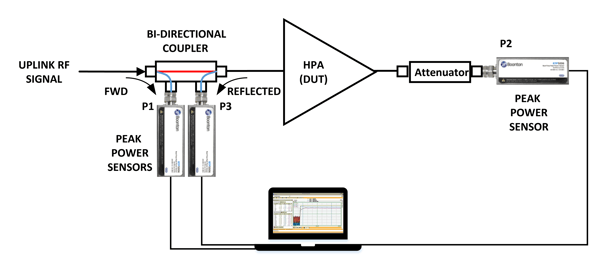
The test setup below shows how three USB peak power sensors, a directional coupler, and a PC with the sensor control software can provide gain and return loss measurements of a high power amplifier (HPA). Satellite communications networks typically use HPAs in the uplink and downlink chains to boost the signal’s power right before transmission.
Return Loss
One sensor (P1) captures the forward power at the directional coupler’s forward (FWD) port, while another (P3) captures the reflected power at the directional coupler’s reverse (REV) port. Return loss analyzes the difference between forward and reflected power measurements, quantifying the power reflected back from the amplifier under test. A high return loss value indicates minimal reflections and more efficient operation.
After measuring and calibrating out losses in the signal path, amplifier input return loss can be calculated by:
Amplifier input return loss (dB) = amplifier input power (dBm) – amplifier input reflected power (dBm)
Amplifier Gain
Gain is used to understand the amount the signal strength increases after passing through the amplifier. Using the incident power level (P1) and output power level captured by the peak power sensor labeled P2, and after allowing for path losses, the amplifier gain can be calculated by:
Amplifier gain (dB) = amplifier output power (dBm) – amplifier input power (dBm)
Signal Compression
Higher order modulation schemes used in 5G non-terrestrial networks (NTN) and other emerging applications increase a signal’s peak-to-average power ratio (PAPR) or crest factor. Amplifiers can distort high PAPR signals, introducing errors into the system and degrading performance. Peak power sensors (P1 and P2) can assess amplifier linearity and the degree of signal compression with crest factor measurements and complementary cumulative distribution function (CCDF) plots, which display crest factor values statistically. Observing a reduction in the amplifier output CCDF curve in relation to the input curve indicates amplifier compression.
The video, “How to Characterize a Communications Amplifier with Boonton Peak Power Sensors,” provides a walkthrough of the Boonton Power Analyzer software during the analysis of an amplifier as it increases the power of an OFDM waveform. Watch below to see how the CCDF plot of the amplifier's input and output signals reveals nonlinear behavior.
Available Now: Article on Satellite Uplink and Downlink Testing
Beyond output power, gain, and compression testing, additional physical-layer measurements critical for network reliability and performance include local oscillator (LO) substitution, phase noise measurements, receiver stress testing, and antenna pattern evaluation.
For an in-depth look at each of these measurements, read the article, “Testing satellite uplink and downlink chains,” by Bob Buxton, Product Manager at Boonton. The article is currently featured in EE World’s 2023 Test & Measurement Handbook.
Check out the article today to ensure optimal testing of your satellite uplink and downlink paths.